HOMEWORK 05
Arithmetic Mean: Derivations and Generalization
In mathematics and statistics, the arithmetic mean is the sum of a collection of numbers divided by the count of numbers in the collection1. Its formula is: \((1/n)*\sum_{i=1}^{n }\ a_{i}\)
The arithmetic mean is the most commonly used and readily understood measure of central tendency in a data set. In statistics, the term average refers to any of the measures of central tendency. Actually mean functions tend to represent the whole set of values with a single number…its about synthesis of the population. Arithmetic mean is just one of the many different function used to analyze distriubtion and with it follow some derivations:
Geometric Mean
The geometric mean is a mean or average which indicates a central tendency of a set of numbers by using the product of their values 2 (as opposed to the arithmetic mean which uses their sum). The geometric mean is defined as the nth root of the product of n numbers, i.e., for a set of numbers x1, x2, …, xn, the geometric mean is defined as
\((\prod_{i=1}^{n} x_1)^{1/n}=\sqrt[n]{x_1 x_2 ... x_n}\)
Harmonic Mean
It’s one of several kinds of average. It is sometimes appropriate for situations when the average rate is desired. The harmonic mean can be expressed as the reciprocal of the arithmetic mean of the reciprocals of the given set of observations3. \(H = \frac{n}{\frac{1}{x_1}+\frac{1}{x_2}+...+\frac{1}{x_n}}\)
Weighted Arithmetic Mean
The weighted arithmetic mean is similar to an ordinary arithmetic mean (the most common type of average), except that instead of each of the data points contributing equally to the final average, some data points contribute more than others. The notion of weighted mean plays a role in descriptive statistics and also occurs in a more general form in several other areas of mathematics4. \((1/n)*\sum_{i=1}^{n }\ w_{i}*a_{i}\)
It can be thought as a generalization of the standard arithmetic mean: actually if all the weights are equal, then the weighted mean is the same as the arithmetic mean.
Generalized Mean
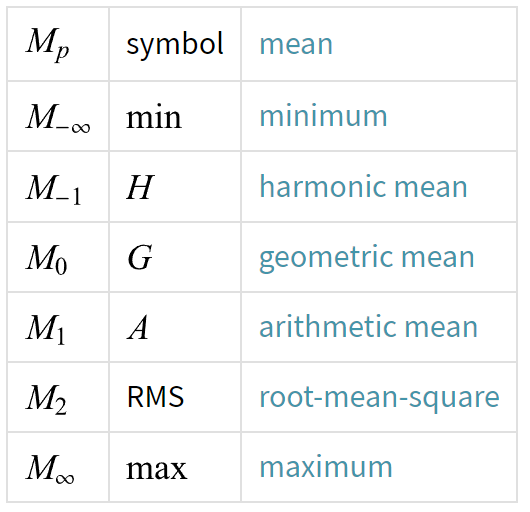
Also known as power mean or Hölder mean are a family of functions for aggregating sets of numbers. A power mean is a mean of the form \(M_p(x_1,...,x_n)=(\frac{1}{n}\sum_{i=1}^{n}{x_i^p})^{1/p}\) Where $p$ is a non-zero real number, and $x_1,…,x_n$ are positive real numbers. The following table summarizes some common named means that are special cases of the generalized mean, where 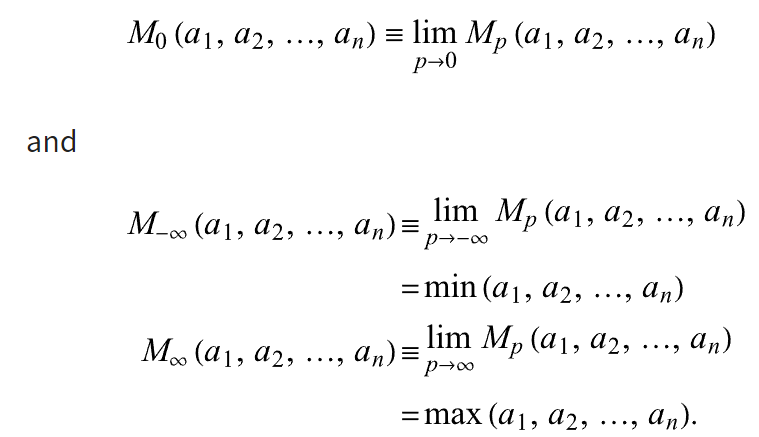
Mathematical Convergence vs Convergence in Probability
Convergence, in mathematics, property (exhibited by certain infinite series and functions) of approaching a limit more and more closely as an argument (variable) of the function increases or decreases or as the number of terms of the series increases. For example, the function y(x) = 1/x converges to zero as x increases. Although no finite value of x will cause the value of y to actually become zero, the limiting value of y is zero because y can be made as small as desired by choosing x large enough5.
Convergence in probability is said to be non-deterministic, stablished by the weak law of large numbers.
Convergence in distribution is in some sense the weakest type of convergence 6. All it says is that the CDF (cumulative distribution function) of Xn’s converges to the CDF of \(X\) as n goes to infinity. It does not require any dependence between the \(X_n\) and \(X\).
In particular, for a sequence \(X_1, X_2, X_3\) ⋯ to converge to a random variable \(X\), we must have that \(P(Abs(Xn−X)≥ϵ)\) goes to 0 as \(n→∞\), for any \(ϵ>0\).
Convergence in probability is stronger than convergence in distribution 7. When we refer about converge in probability, we are referring to convergence of a set of random variables \(X_1,X_2,…,X_N\) to a distribution \(X\) This, as opposed to point-wise convergence, is a function-wise convergence.
Differences between Descriptive Statistics and Inferential Statistics, the role of probability and probability distributions
With Inferential Statistics the dataset we use to retrieve information is just a limmited subset of the whole population: we try to draw conclusion about an unknown theorical population from a sample. Actually this kind of statistics infers properties of a population, which is said to be unknown.
On the other hand, in descriptive statistics what what we retrieve from a dataset is an empirical distribution, that’s because the sample is actually representative of the whole population.
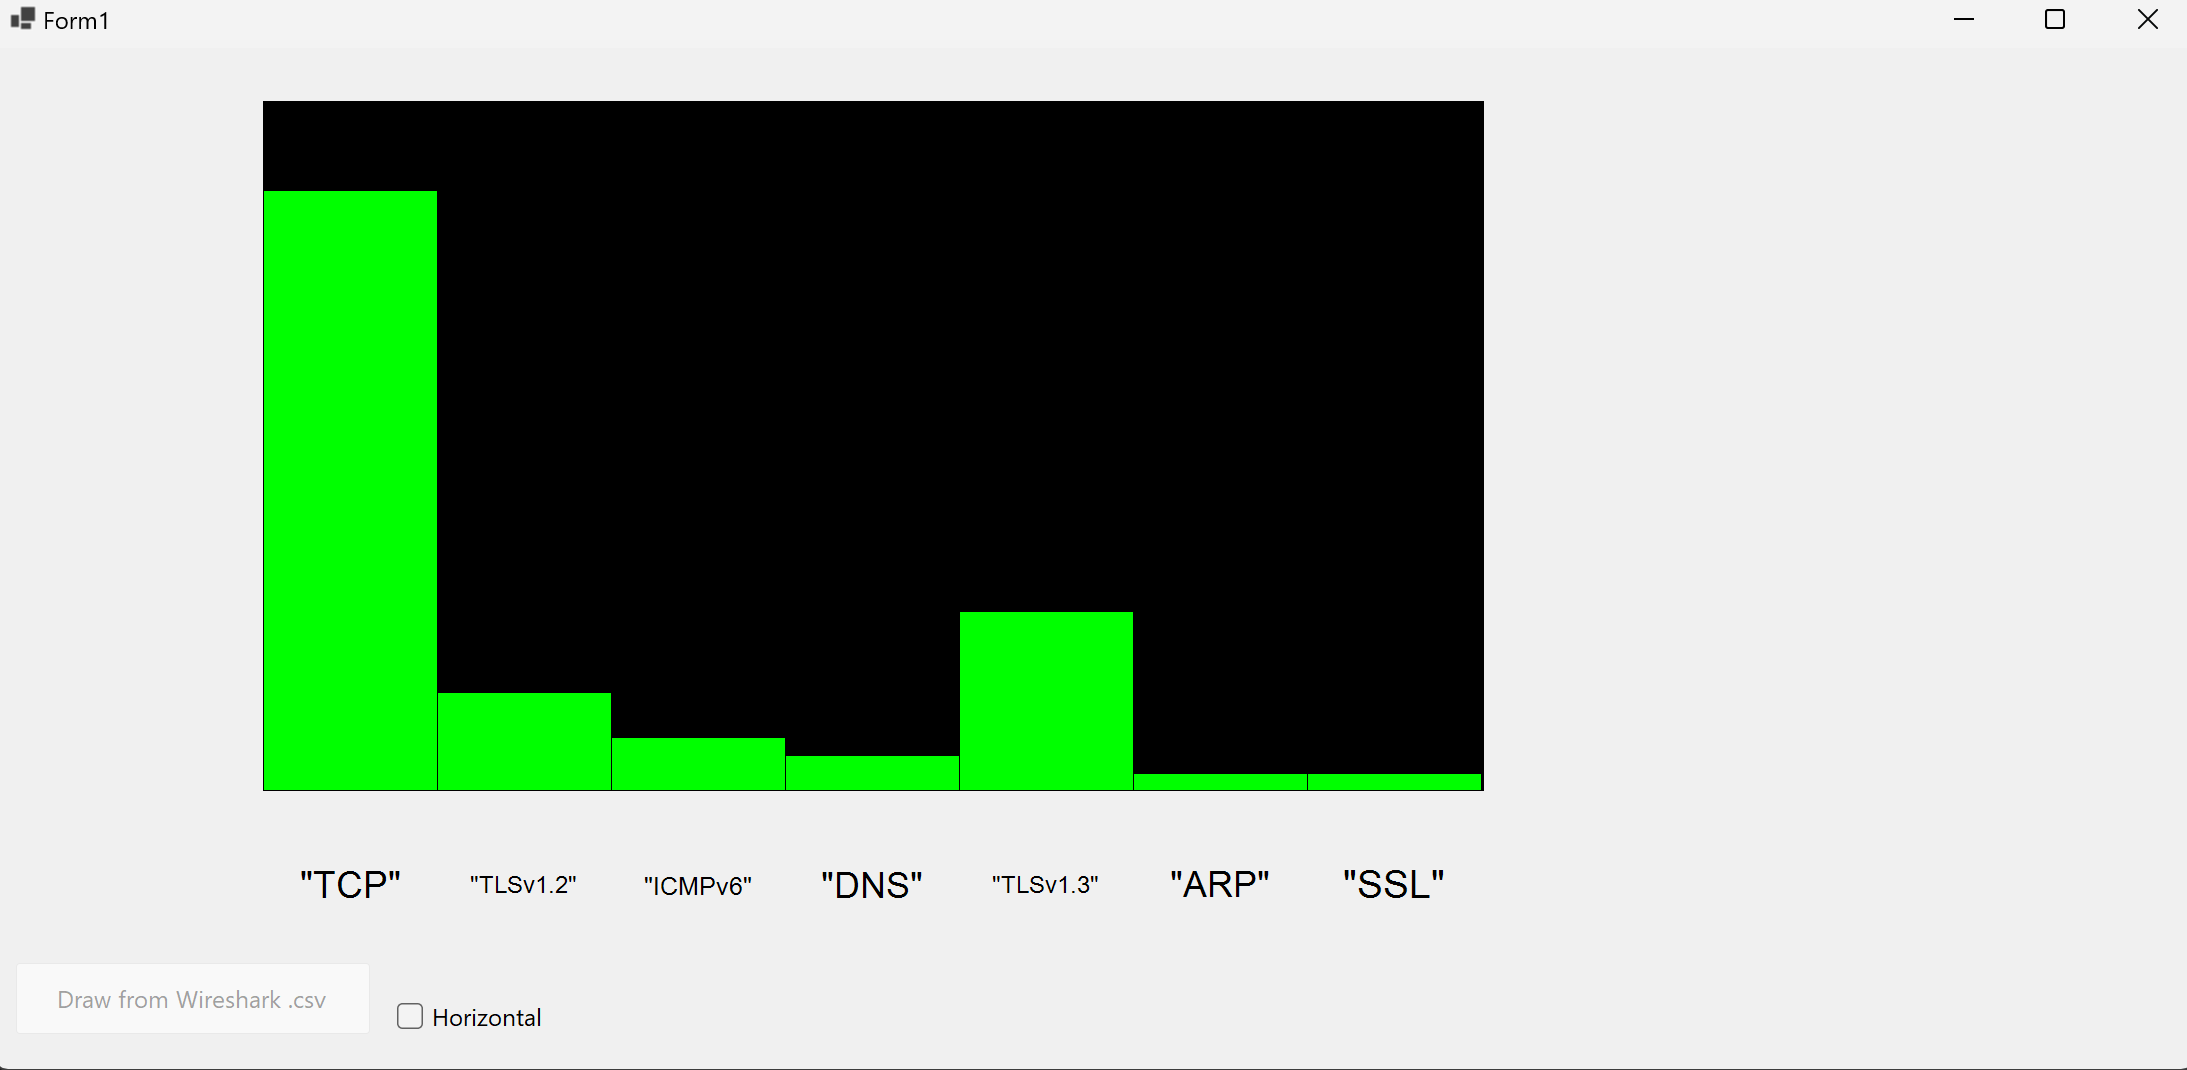
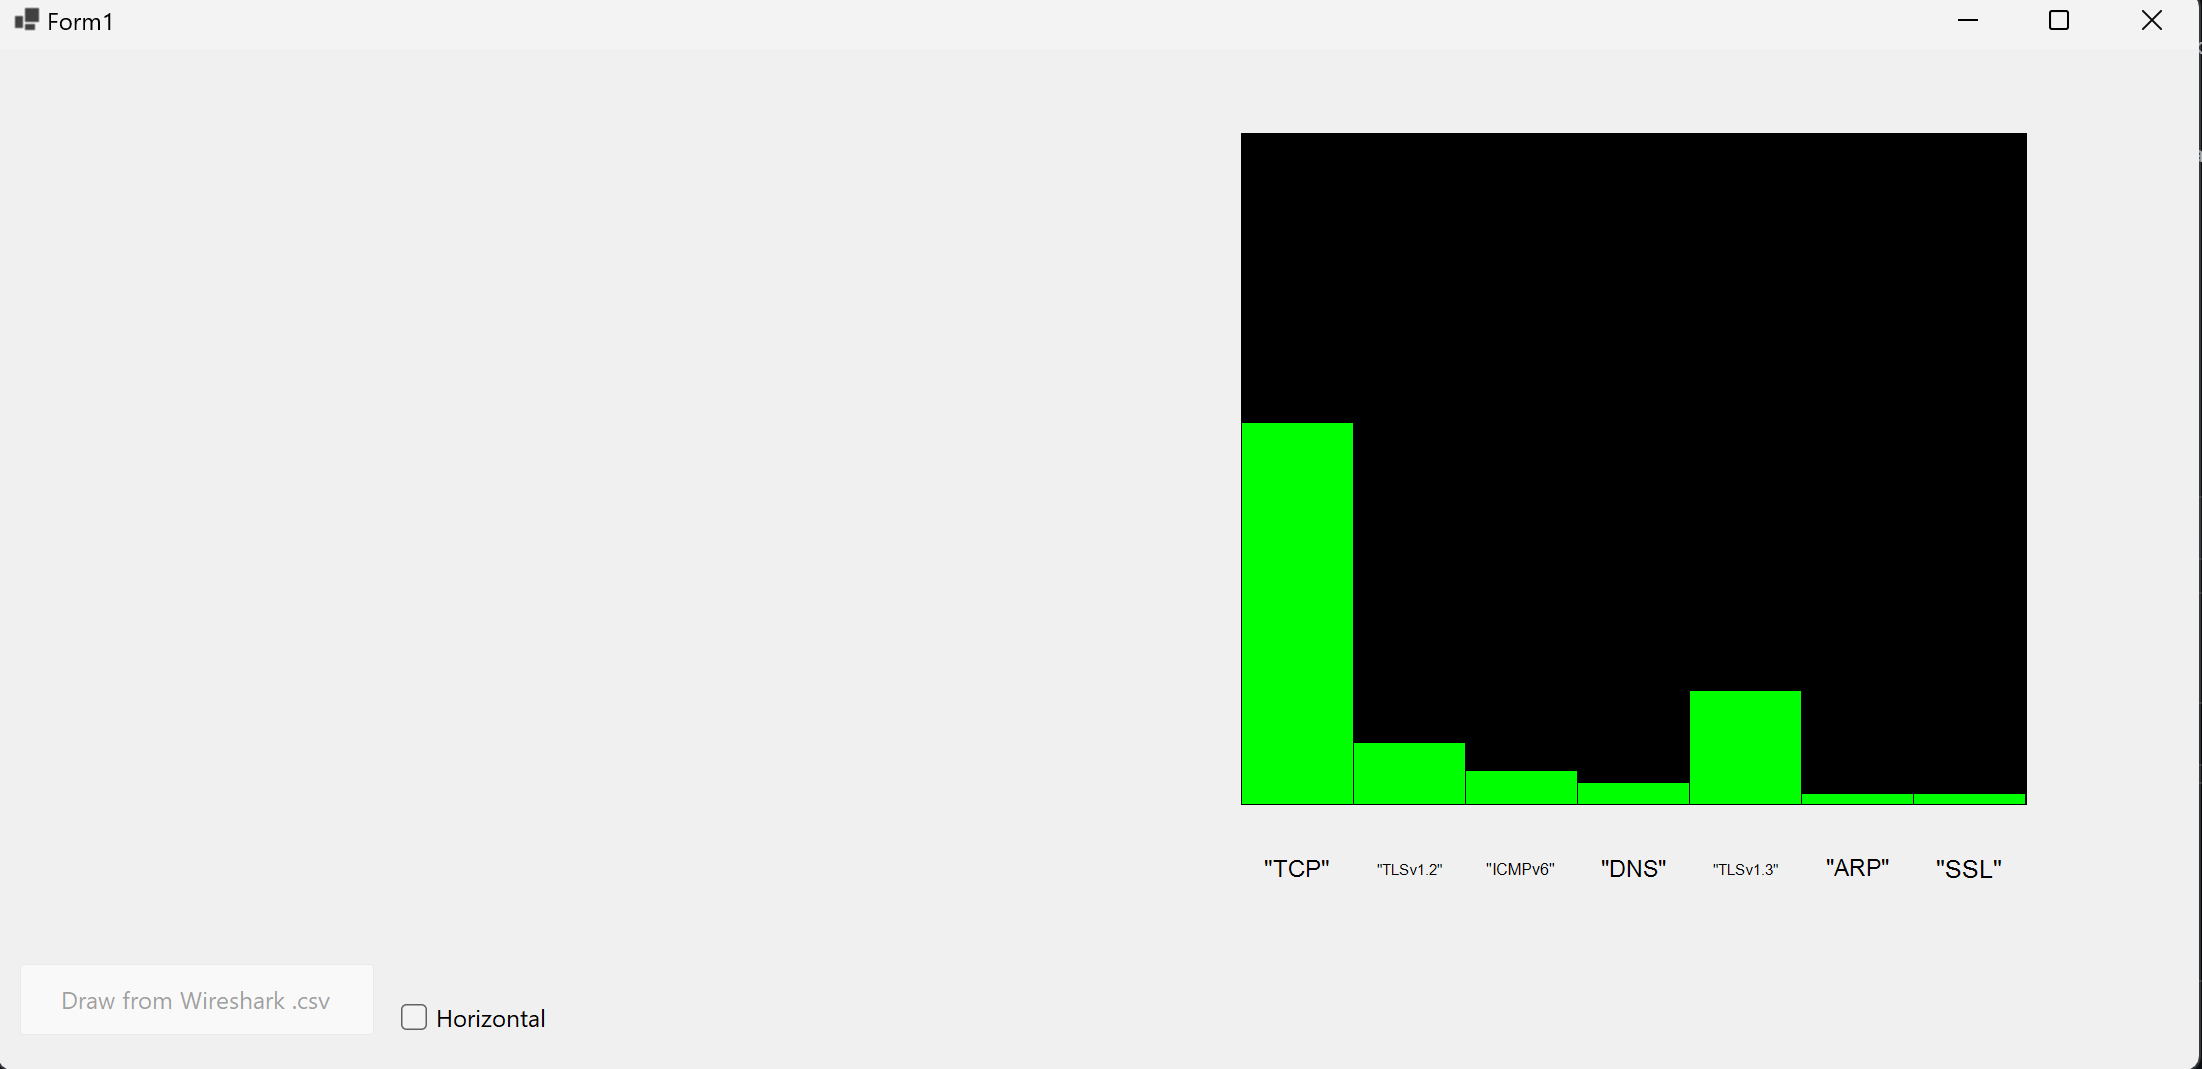
Application
Here’s an application that meets both features. Code can be found in Github or can be downloaded.

-
Wikipedia, Arithmetic Mean: https://en.wikipedia.org/wiki/Arithmetic_mean ↩
-
Wikipedia, Geometric Mean: https://en.wikipedia.org/wiki/Geometric_mean ↩
-
Wikipedia, Harmonic Mean: https://en.wikipedia.org/wiki/Harmonic_mean ↩
-
Wikipedia, Weighted Arithmetic Mean: https://en.wikipedia.org/wiki/Weighted_arithmetic_mean ↩
-
Britannica.com, convergence: https://www.britannica.com/science/convergence-mathematics ↩
-
Probabilitycourse: https://www.probabilitycourse.com/chapter7/7_2_4_convergence_in_distribution.php ↩
-
Probabilitycourse: https://www.probabilitycourse.com/chapter7/7_2_5_convergence_in_probability.php ↩