HOMEWORK 06
What do we mean by Population?
A population is the complete set group of individuals, whether that group comprises a nation or a group of people with a common characteristic. In statistics, a population is the pool of individuals from which a statistical sample is drawn for a study. Thus, any selection of individuals grouped by a common feature can be said to be a population. A sample may also refer to a statistically significant portion of a population, not an entire population. For this reason, a statistical analysis of a sample must report the approximate standard deviation, or standard error, of its results from the entire population. Only an analysis of an entire population would have no standard error.
What’s a Sampling Distribution?
In statistics, a sampling distribution is the probability distribution of a given random-sample-based statistic. If an arbitrarily large number of samples, each involving multiple observations (data points), were separately used in order to compute one value of a statistic (such as, for example, the sample mean or sample variance) for each sample, then the sampling distribution is the probability distribution of the values that the statistic takes on. In many contexts, only one sample is observed, but the sampling distribution can be found theoretically. The sampling distribution of a given population is the distribution of frequencies of a range of different outcomes that could possibly occur for a statistic of a population. A population is the entire pool from which a statistical sample is drawn.
Show the expected value and variance of the sampling mean and take a look at the same sampling variance
In probability theory, the expected value (also called expectation, expectancy, mathematical expectation, mean, average, or first moment) is a generalization of the weighted average. Informally, the expected value is the arithmetic mean of a large number of independently selected outcomes of a random variable. The expected value of a random variable with a finite number of outcomes is a weighted average of all possible outcomes. In the case of a continuum of possible outcomes, the expectation is defined by integration.
The expected value of a random variable \(X\) is often denoted by \(E[X]\). Consider a random variable X with a finite list \(x_1, ..., x_k\) of possible outcomes, each of which (respectively) has probability \(p_1, ..., p_k\) of occurring. The expectation of \(X\) is defined as
\(E[X]\) = \(x_1p_1+x_2p_2+...+x_kp_k\). Since the probabilities must satisfy \(p_1 + ⋅⋅⋅ + p_k\) = 1, it is natural to interpret \(E[X]\) as a weighted average of the \(x_i\) values, with weights given by their probabilities \(p_i\).
Given a sequence of identical distributed and indipendent random variables \(X_i\) for i ∈ N, we can define the mean random variable called “sample mean” as the following: \(\bar{X}=\frac{\sum_i X_i}{n}\)
Let’s now compute the expected value and variance of the sample mean:
\[E(\bar{X})=E(\frac{\sum_iX_i}{n})=\frac{1}{n}\sum_iE(X_i)=\frac{1}{n}nE(X)=E(X)\] \[Var(\bar{X})=Var(\frac{\sum_i X_i}{n})=\frac{1}{n^2}Var(\sum_i X_i)=\frac{1}{n^2}nVar(X)=\frac{\sigma ^2}{n}\]We can see that the expected value of the sampling mean is equal to the mean value computed on the population. We also notice that the larger the sample size (equal to the standard deviation over n), the smaller the variance of the sampling mean (it actually tends to zero).
Sample Variance
The sample variance, S, is used to calculate how varied a sample is. \(S=\frac{1}{n}\sum_{i=1}^n(X_i-\bar{X})^2\)
\[E(S)=E(\frac{1}{n}\sum_{i=1}^n(X_i-\bar{X})^2)=\frac{n-1}{n}\sigma ^2\] \[Var(S)=Var(\frac{1}{n}\sum_{i=1}^n(X_i-\bar{X})^2)=\frac{\mu_4}{n}-\frac{\sigma ^4(n-3)}{n(n-1)}=\frac{1}{n}(\mu_4-\frac{n-3}{n-1}\sigma ^4)\]Where where $\mu_4$ is the fourth central moment of $X$ and its value is $E((X-\bar{X})^4)$ .
Application
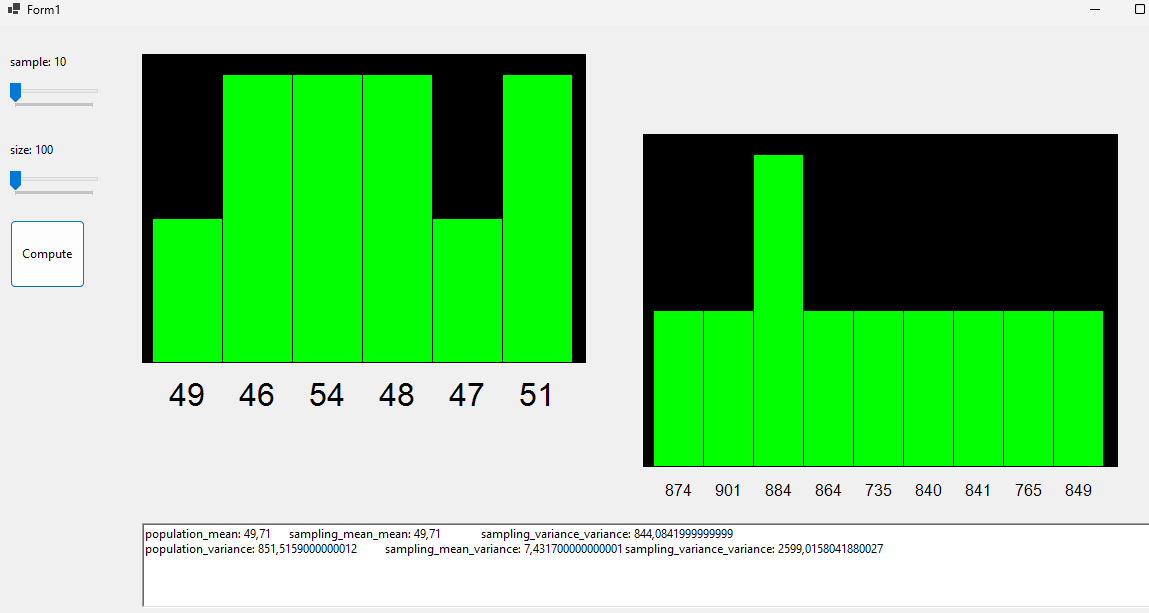
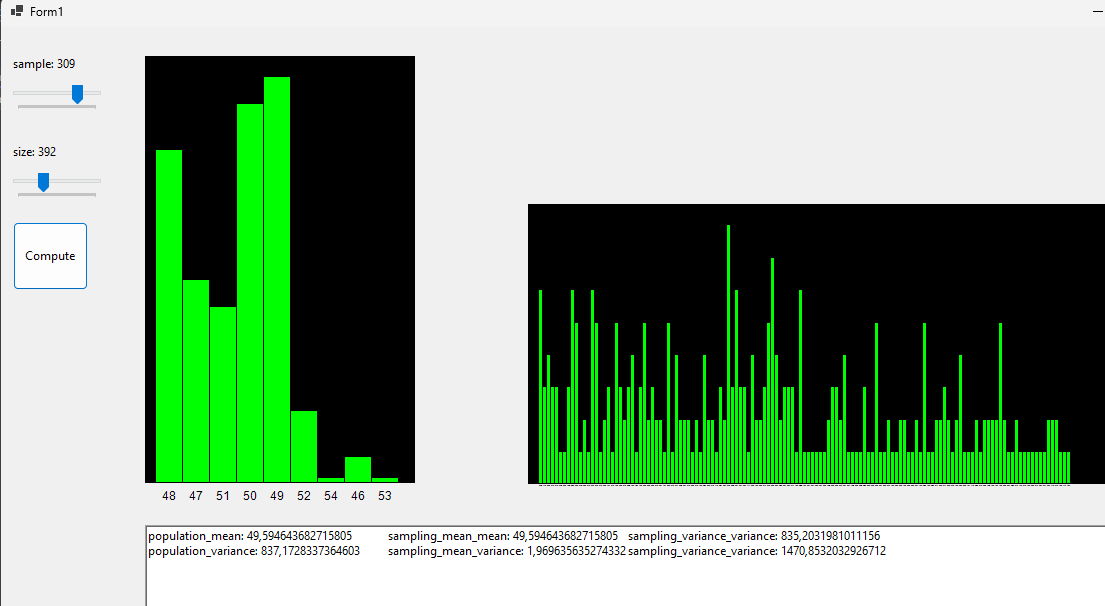
What follos is an app that simulates \(m\) samples of \(n\) size each. The random variable used is an abstract datatype with only one integer value (could be expanded). What the program does is plotting Distribution of the Mean and Distribution of the Variance, then confrontates these datas with the whole population’s statistics.


Code avaible on GitHub and on Drive.